APPENDIX
III-M:
Final 1999
This
map reflects surveillance findings occurring between
as reported to CDC's ArboNET system for public
distribution by state and local health departments.
Click here for
a printer friendly version.
Final 2000
This
map reflects surveillance findings occurring between
as reported to CDC's ArboNET system for public
distribution by state and local health departments.
Click here for
a printer friendly version.
Final
2001
This map reflects surveillance findings occurring
Click here for
a printer friendly version.
Final
2002
This map reflects surveillance findings occurring
Click here for
a printer friendly version.
http://www.cdc.gov/ncidod/dvbid/westnile/Mapsactivity/surv&control02Maps.htm
Final
2003
This
map reflects surveillance findings occurring between
as reported to CDC's ArboNET system for public
distribution by state and local health departments.
Click on the map
for a printer friendly version.
http://www.cdc.gov/ncidod/dvbid/westnile/Mapsactivity/surv&control03Maps.htm
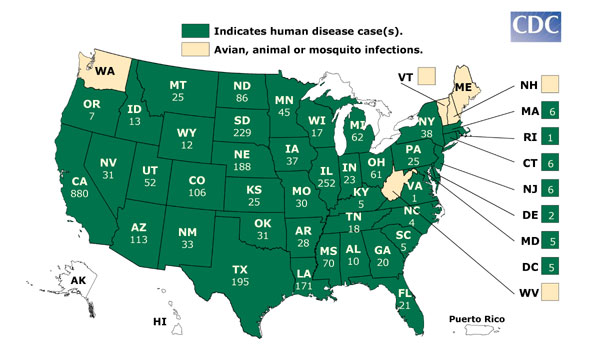
Final 2004
This
map reflects surveillance findings occurring between
as reported to CDC's ArboNET system for public
distribution by state and local health departments.
Click on the map
for a printer friendly version.
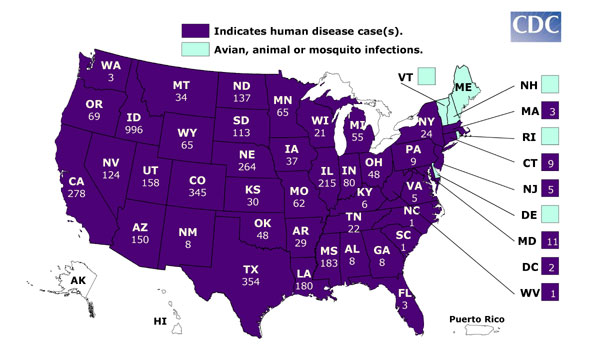
Final 2005
This
map reflects surveillance findings occurring between
as reported to CDC's ArboNET system for public
distribution by state and local health departments.
Click on the map
for a printer friendly version.
http://www.cdc.gov/ncidod/dvbid/westnile/Mapsactivity/surv&control05Maps.htm
|
Final 2006 Map shows the distribution of avian, animal, or mosquito
infection occurring during 2006 with number of human cases if any, by state.
If |
http://www.cdc.gov/ncidod/dvbid/westnile/Mapsactivity/surv&control06Maps.htm